


What if you could snap your fingers and make all the problems at your golf course go away?
Too far-fetched? What if you could access a repository of knowledge that clearly illustrates why you’re having problems, and it provides tips on how to solve them?
That’s exactly what Mike Suglich, founder and president of Greenlight Advisors, wants to do.
Suglich started developing national benchmarks for municipal golf course operators in 2022 by gathering data points from courses across the country.

The resulting study was published to give courses benchmarks against which they measure their success (or lack thereof). Every subsequent iteration of the study has gotten more respondents, and more data means more granular, actionable information that courses can use to make improvements.
The latest 2024 study included the National Golf Course Owners Association, Troon and Landscapes Golf Management as partners, and involved courses from Salt Lake City, Orlando, Chicago, San Antonio, Cincinnati and many more in between. Troon and Landscapes Golf Management are both certified partners of Greenlight Advisors’ GolfClubBenchmarks.com service.
The results of the study have allowed Greenlight Advisors to construct a “Best-in-Class Report Card” for any course which compares 11 specific metrics between a given course and the national average. In some cases, that comparison can also be done on a regional level. This kind of enhanced granularity is exactly what Suglich is hoping to get.
“I take the averages on income, revenue and expense line items and show how they compare against industry averages, where they’re up or down,” Suglich said. “If they’re down, I put a red traffic light [on the report card], and tell [course owners], ‘You’re not meeting the industry average in revenue,’ or ‘You’re not meeting the industry average in expenses. You’re higher than the average. If you were able to get yourself back to average, you would make more money.’”
Justification for budgets

Making more money is all well and good by itself, but for a municipal course, showing profitability is also important for your overlords: the city itself.
Matt Kammeyer, golf division director for Salt Lake City, said all six of the city’s municipal courses participated in the 2024 study, and the resultant data is incredibly helpful when it’s time to pay the piper.
“It helps me tell a story to our city council, for instance, when we’re doing a budget presentation,” he said.
He uses the example of water costs and where they try to conserve as much as they can.
“Within our municipal entity, water costs have risen quite dramatically over the past four years,” Kammeyer said. “It’s been a 75% increase in costs for us. So I’m interested to see what other courses are paying and where we fit within that as a percentage of our overall budget.”
Performance across quartiles
Participating courses share 20 financial and 20 operational metrics, such as golf operations margin, golf course maintenance expense, golf course maintenance per acre, revenue per employee and more.
Those values are then used to calculate averages on a national level as well as a regional level: Northwest, Southwest, Midwest, Northeast and Southeast. As more courses participate, those regional averages will eventually become state specific.
Within each data type, the numbers are broken down into quartiles that are then used to construct the report cards that give an at-a-glance view of a course’s performance. Essentially, it shows whether a course is in the top 25%, the middle 50% or the bottom 25%.
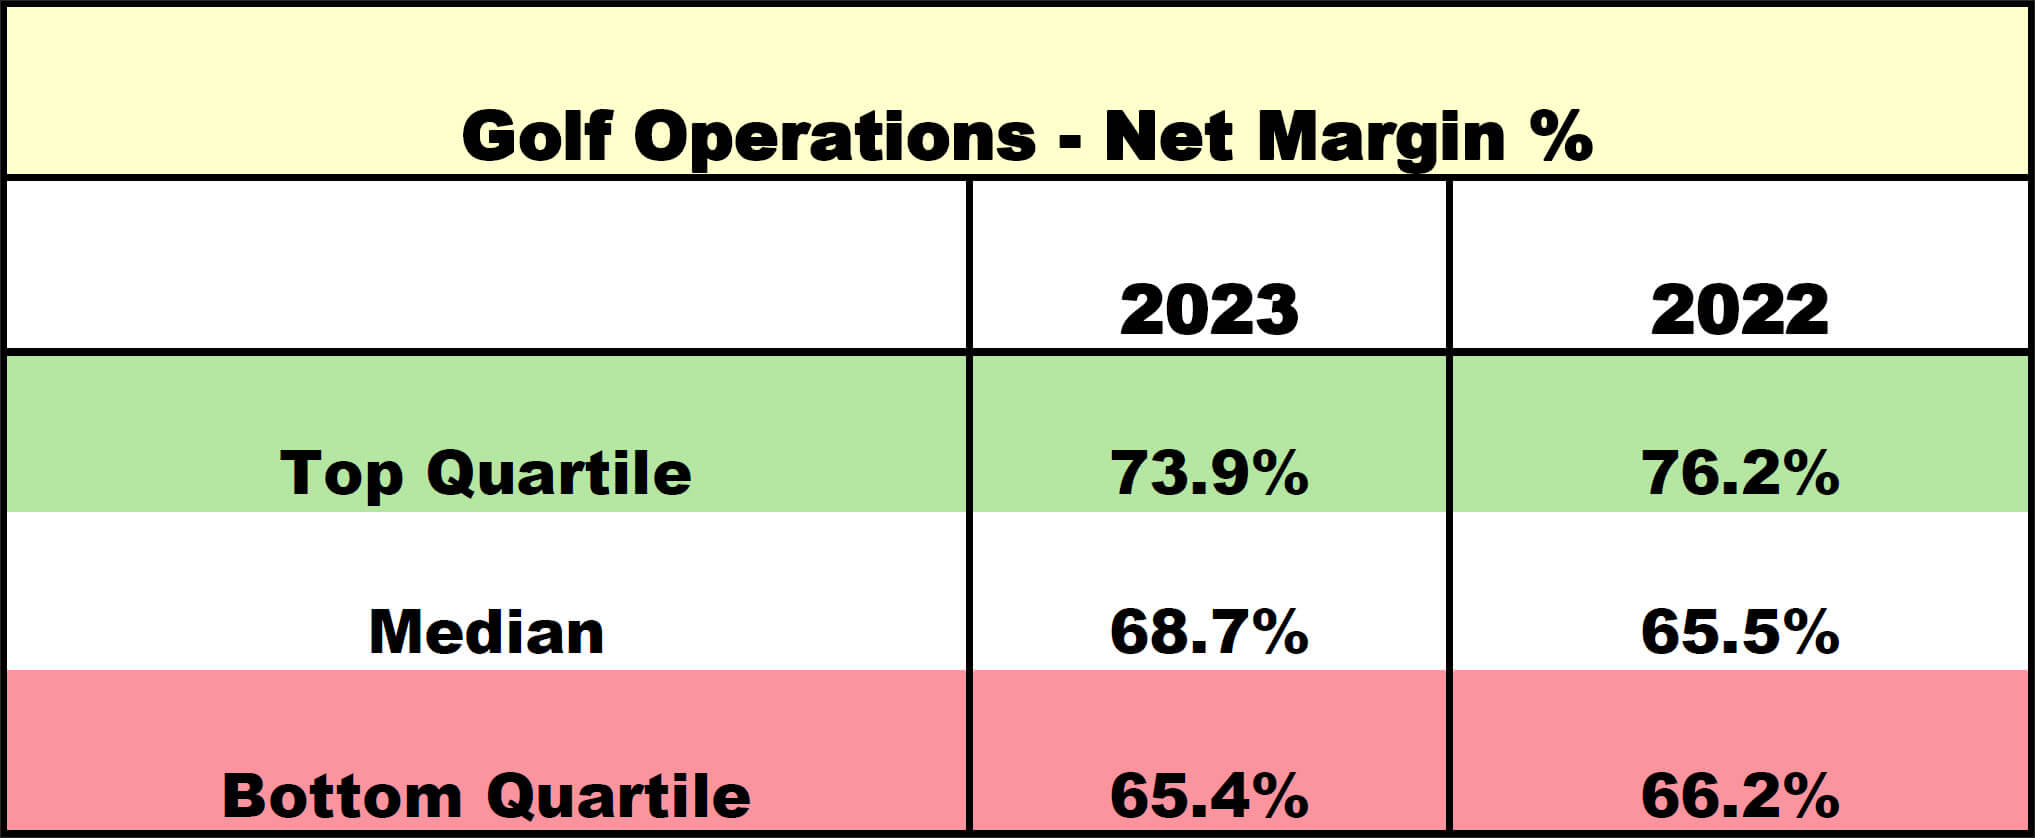
For example, courses in the top quartile have a 73.9% net margin percentage in their golf operations, while courses in the bottom quartile are almost nine points lower with 65.4%.
These numbers are calculated by taking total golf operations revenues (green fees, cart fees, driving range admission, retail merchandise, pass sales) minus total golf operations costs (golf shop labor expenses, retail merchandise), then dividing that number by the total golf operations revenues.
Clearly, less money spent on operations expenses leads to a higher net margin. But only 8.5 points separate the top and bottom. Other metrics are less obvious and benefit even more from the study’s data.
One such metric is clubhouse and admin expense as a percentage of revenue. Courses in the top quartile spend only 19.2% of their revenue on clubhouse and admin expense, while courses in the bottom quartile spend a staggering 59.6%. Seeing the data laid bare in such a way can prompt courses in the bottom to take action.
A broader perspective
The risk of long-term sustainability is a concern with municipal courses, who must answer to their city councils. That kind of conversation tends to take place at courses that aren’t keeping an eye on things such as green fees (e.g., their fees are too low compared to others in the region) and consequently lack the revenue to put back into course improvement.
“They spiral out of control and get worse and worse,” Suglich said. “Play goes down, now the city is losing money, and to keep it open they need to keep funding it and they’re not thinking of a long-term sustainable plan to operate the golf course. If they’re not keeping up with the economy and keeping those greens fees in line with the increase in costs, they’re going to fall further and further behind.”
Kammeyer said that he has been appreciative of the data in the study. While he has a good understanding of how Salt Lake City’s courses measure up against each other, there’s a benefit in seeing how the courses compare against other municipal operations in the area and nationally, or even with private courses.
“I encourage course operators to take the opportunity to submit to the survey and then hopefully they’ll see the benefit of being able to run their budget through the software and take a look at a deeper dive as to how they compare,” Kammeyer said. “The more data they get, the more powerful it will be to the average course operator.”

Currently, the study focuses on municipal golf, which Suglich considers foundational to getting people involved in the game and vital to prolonging the health of the overall golf industry.
Municipal golf offers a low-cost way for people of all ages and skill levels to enjoy the game while driving a sense of community and social cohesion, Suglich said, and it’s a great way to enjoy the outdoors and green spaces of your city and make friends both on and off the course.
“What better way to drive the game of golf than to help the municipal golf industry understand how they can sustain their growth and profitability to keep the game going?” he said. “That’s where everybody starts. That’s where I started.”
Suglich would like to expand to other course types given that the software supports courses ranging from public and resorts to semi-private and private clubs — 80% to 90% of the metrics are similar.
“The private courses are unique because they have a larger food & beverage operation, and their big revenue generators are dues and initiation fees,” he said. “We already have those metrics defined for the private courses and those are fields that we have built into the software, in addition to all of the fields that we capture for the municipal courses.”
To date, the study has been conducted annually, but Suglich hopes it could become quarterly and offer more benefits to both the participating courses and anyone using the metrics for their own comparisons.
OPPORTUNITY TO SHARE
The 2025 study is already in the works. Any course that would like to participate can go to signup.golfclubbenchmarks.com.
(This story originally ran in the July/August 2025 issue of Golf Inc.)